Getting Started
Install Annote, connect your account, and file your first bug in under five minutes.
What is Annote
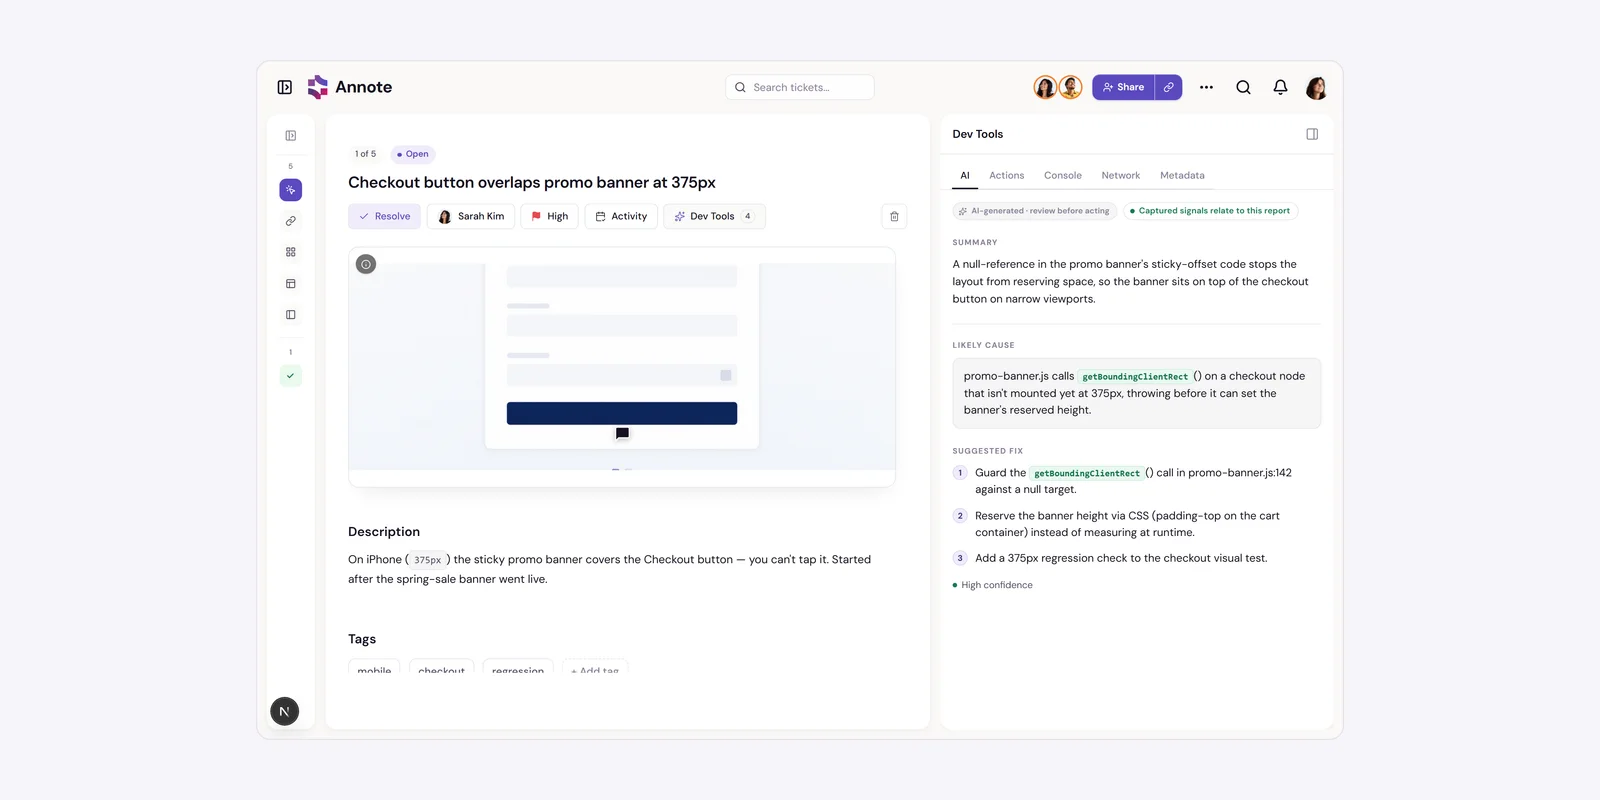
Annote turns a vague bug report into something a developer can act on. Instead of typing “the save button is broken” into Slack, you click the thing that's broken, say or type what's wrong, and Annote writes a structured ticket for you — automatically attaching a screenshot plus the technical evidence behind the bug: the console errors, the network requests, and the actions you took leading up to it.
The flow is always the same three beats: click an element → speak or type what's wrong → Annote's AI writes the ticket and diagnoses the likely cause. Your team picks it up in the Annote dashboard, already triaged.
Install the extension
Annote lives in your browser as a Chrome extension.
- Open the Annote extension in the Chrome Web Store: Install Annote
- Click “Add to Chrome,” then “Add extension” in the confirmation dialog.
- Once installed, the Annote icon appears in your browser toolbar. Click the puzzle-piece icon and pin Annoteso it's always visible.
That's the whole install. There's no setup wizard and no settings to configure — the next step is connecting your account.
Sign in & connect
Here's the part that surprises people: there's no login inside the extension. You don't enter a password into Annote in your browser toolbar.
Instead, Annote connects automatically as long as you're signed in to the Annote website in the same browser. The first time you click the Annote toolbar icon while signed out, it opens the Annote login page in a new tab. Sign in there normally — with Google or your email and password— and the extension connects itself. No copying tokens, no separate “connect” step.
You'll stay connected as long as you're logged into the Annote website in that browser. You'll only be asked to sign in again if you log out of the website or your session expires.
Capture your first bug
With the extension installed and your account connected, here's the full path from broken thing to finished ticket.
- Click the Annote icon in your toolbar. The Annote tray opens on the page.
- Click “Start Session,” then choose how you want to give feedback — Voice (speak naturally) or Write (type it). Voice will ask for microphone permission the first time.
- Click the element that's wrong. Your cursor becomes a marker and elements highlight as you hover. Clicking takes a screenshot of that element and opens a small capture box right next to it.
- Say or type what's wrong, then hit Send (or Enter). A pin drops on the element and the box closes — so you can immediately click the next thing if you want.
- Annote's AI structures your feedback into a ticket in the background — with the screenshot, console logs, network activity, and your actions all attached and correlated. The pin updates to the real ticket title when it's done.
Your session follows you across tabs and pages automatically, so you can reproduce a bug across a flow and keep capturing. When you're done, click End — or the session ends on its own after 30 minutes of inactivity.
Then open the Annote dashboard: your session and its tickets are there, each one already AI-diagnosed with a likely cause and a suggested fix, ready for your team to resolve, assign, and comment on.